
Role
CRO Specialist
Timeline
1 Year 3 Months
Platform
Desktop / Mobile
Tools
 Figma
Figma Optimizely
 GA4
GA4Overview
The Challenge
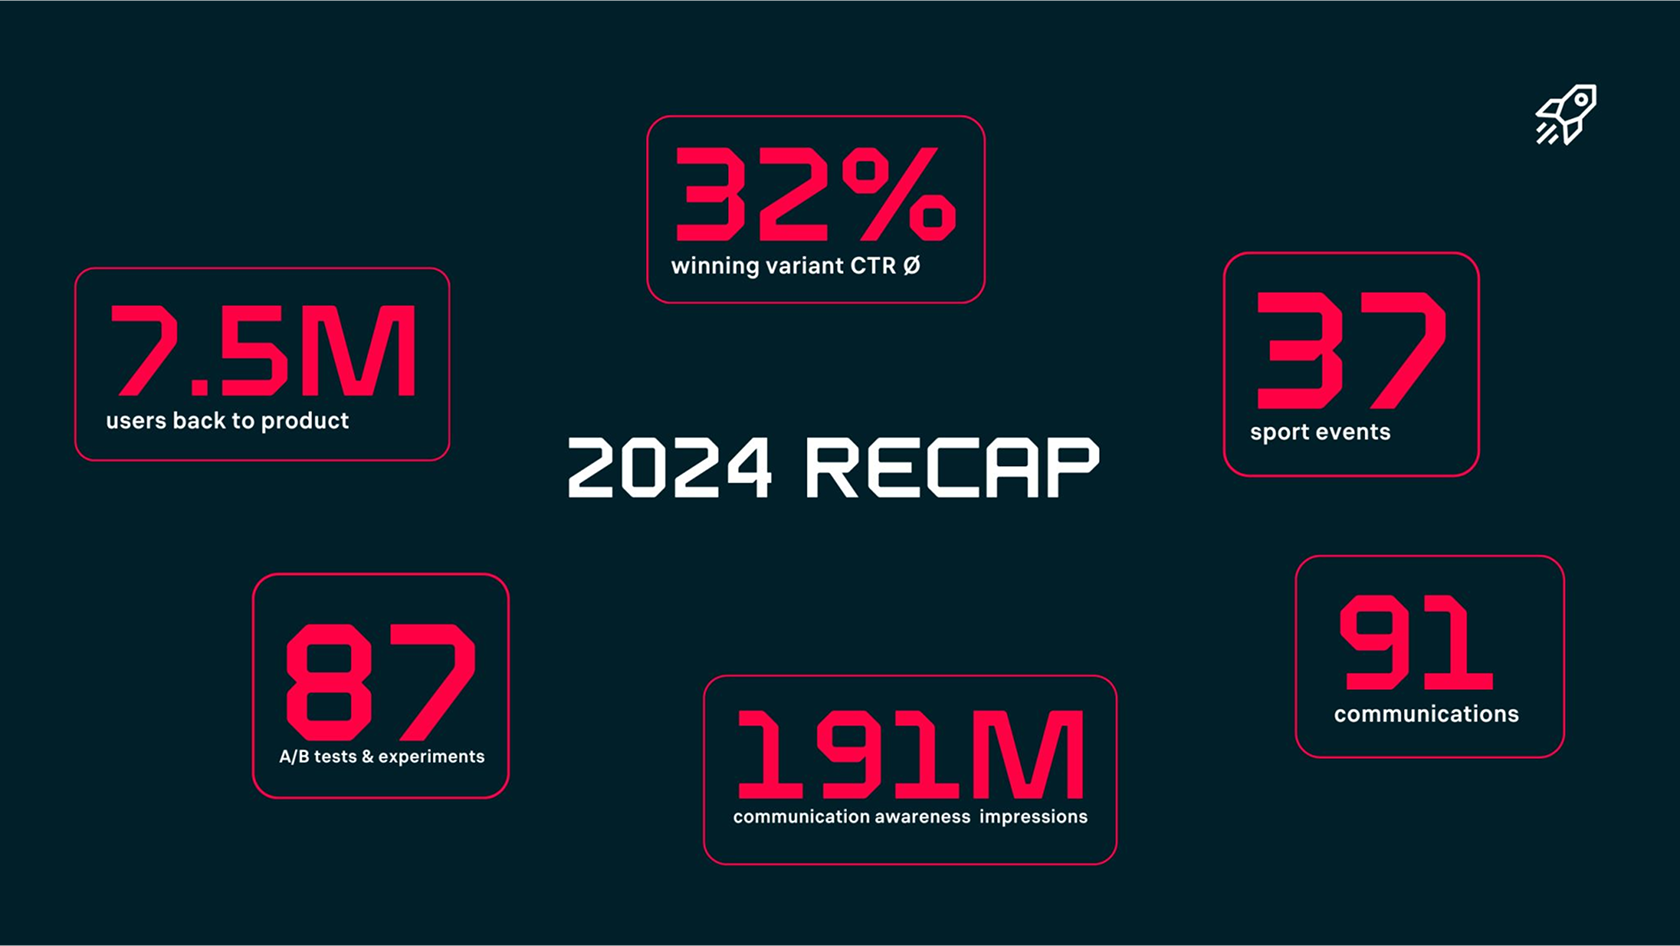
As a UX-focused CRO specialist at Livesport, I worked on a high-traffic sports product with millions of daily users across dozens of markets. My role sat at the intersection of data analysis, UX design, and experimentation — forming hypotheses with product managers and analysts, designing variants, and validating them through controlled A/B tests measured against clear business and guardrail metrics.

Research & Discovery
Key Findings
Small changes — rewording a CTA or repositioning a badge — often moved CTR more than full redesigns did
The vast majority of traffic came from mobile, so desktop-first assumptions consistently undermined test validity
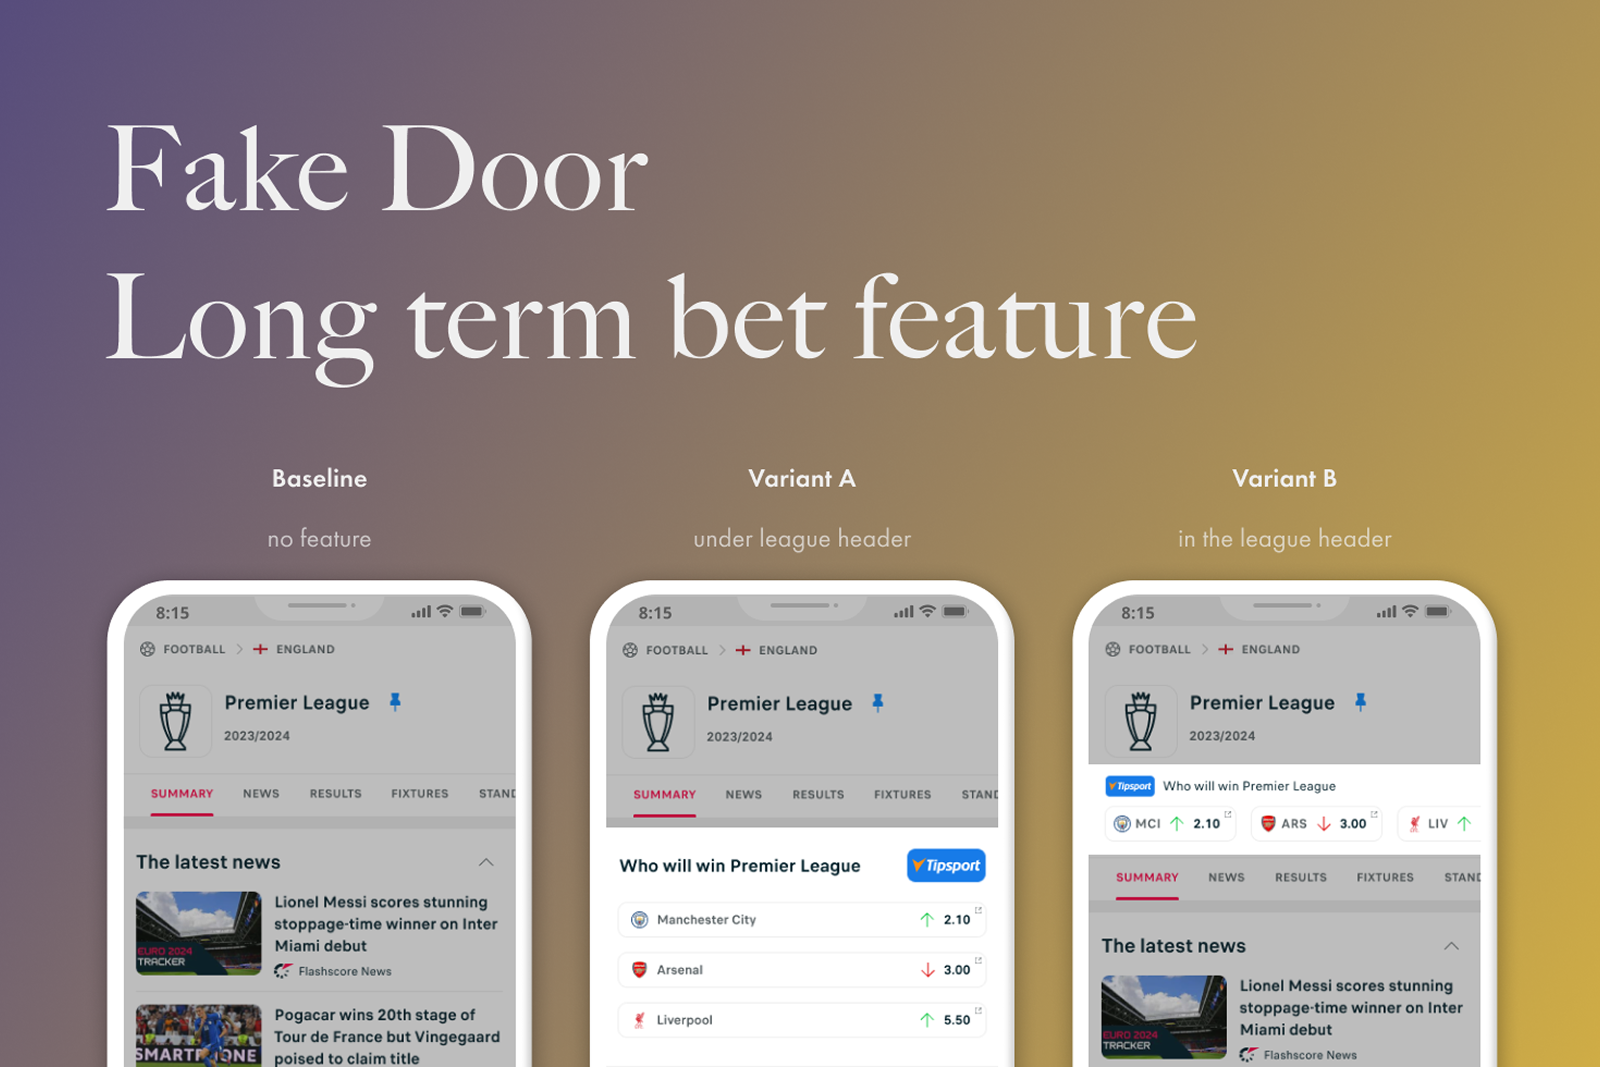
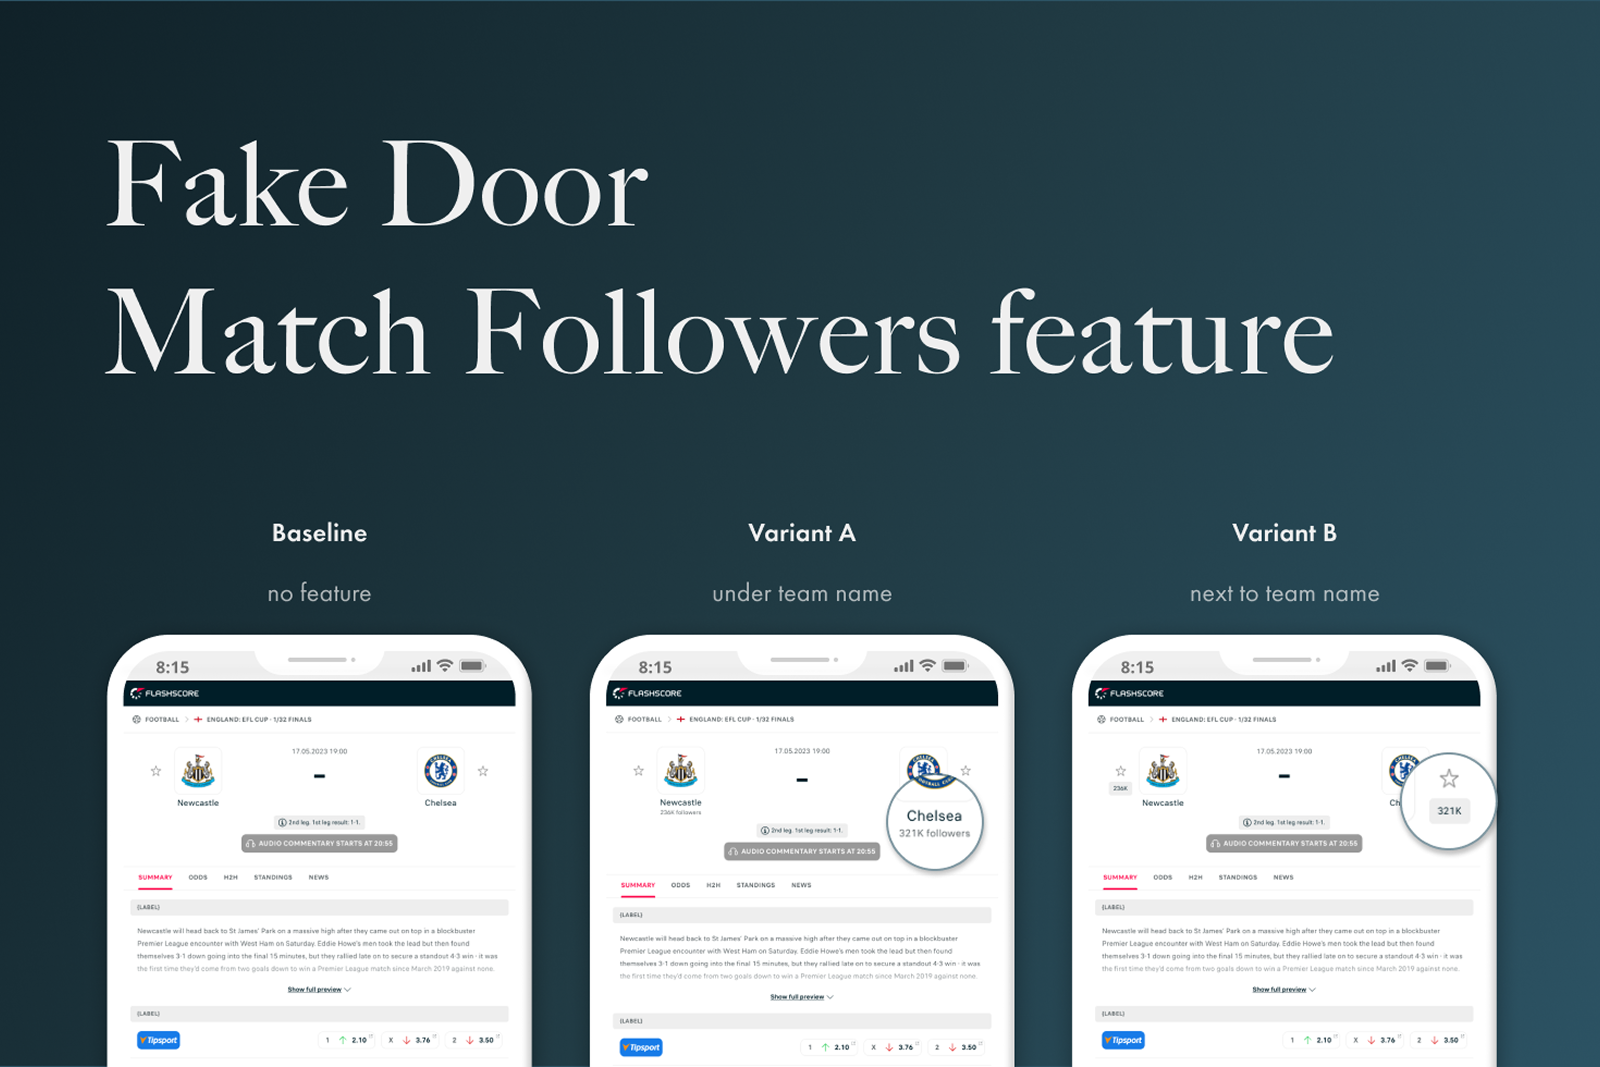
Fake-door tests repeatedly saved development capacity by disproving demand for features that looked promising internally
Design Process
How We Got There
Each experiment began with a hypothesis grounded in observed behaviour — a heatmap anomaly, drop-off in an affiliate funnel, a pattern in session recordings. I sketched multiple variants, from microcopy changes to component rearrangements, and narrowed to the strongest candidates. Before anything was built, every variant was tied to one primary metric and a set of guardrail metrics — typically CTR and FTD revenue.
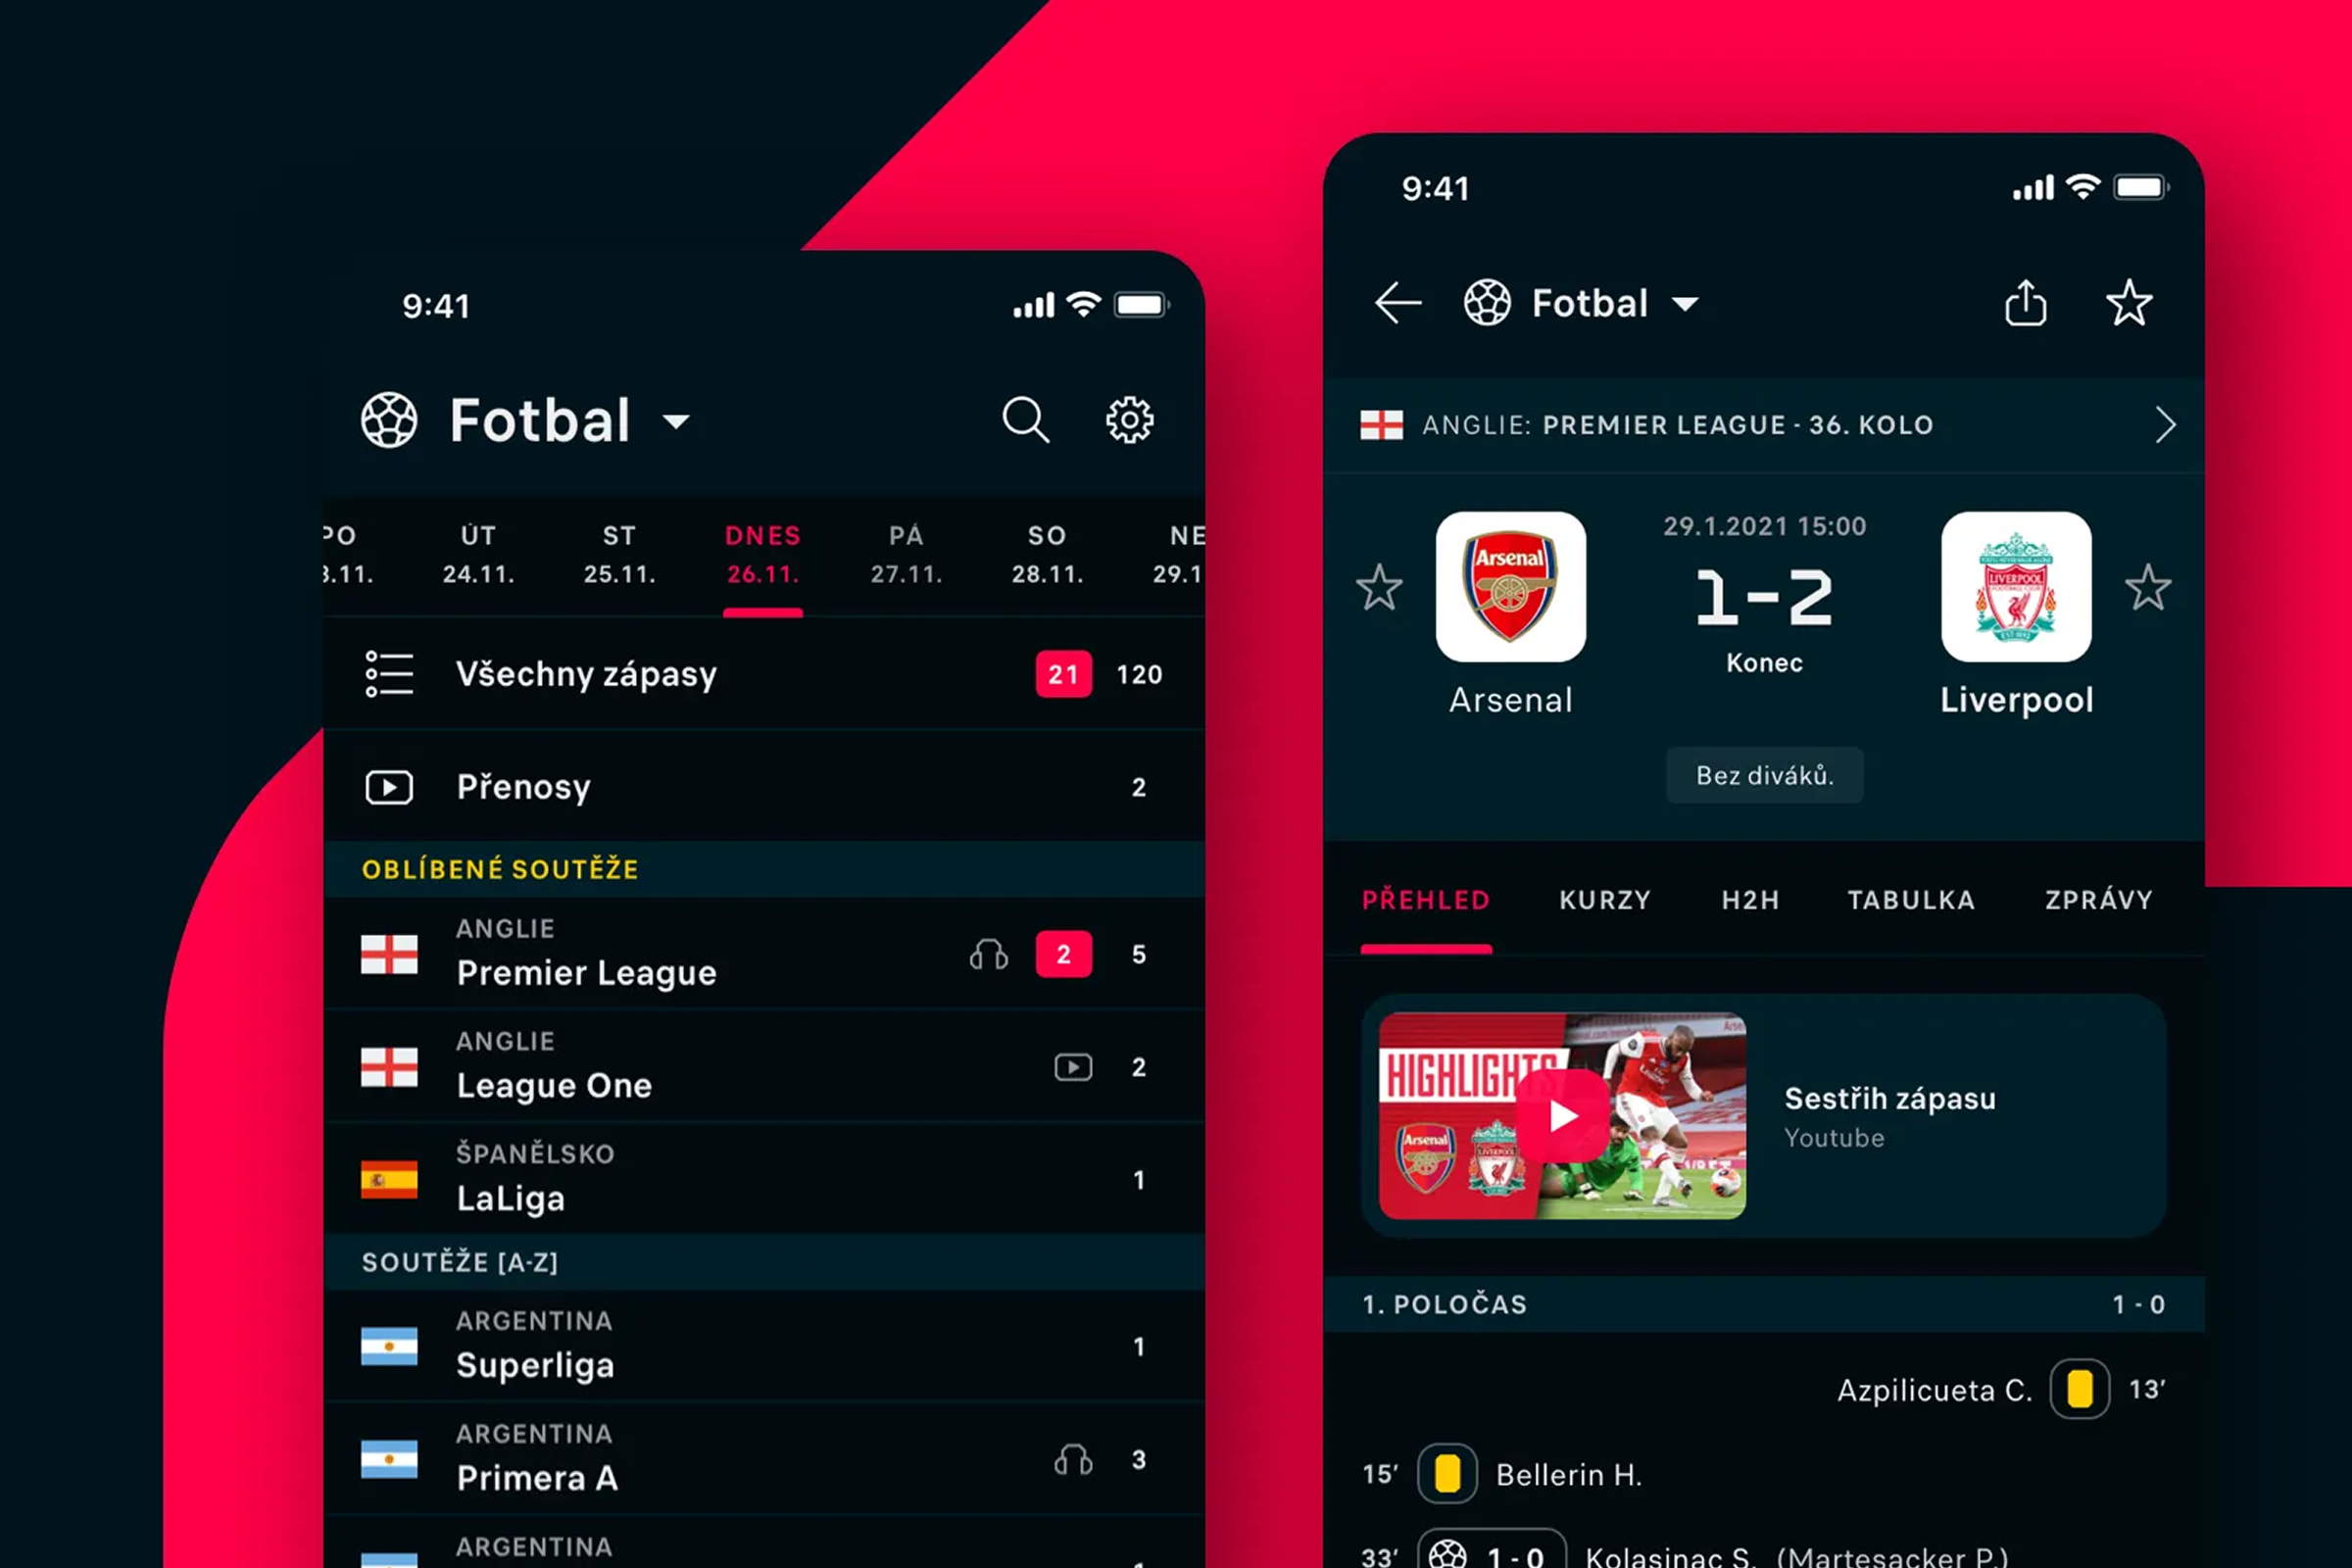
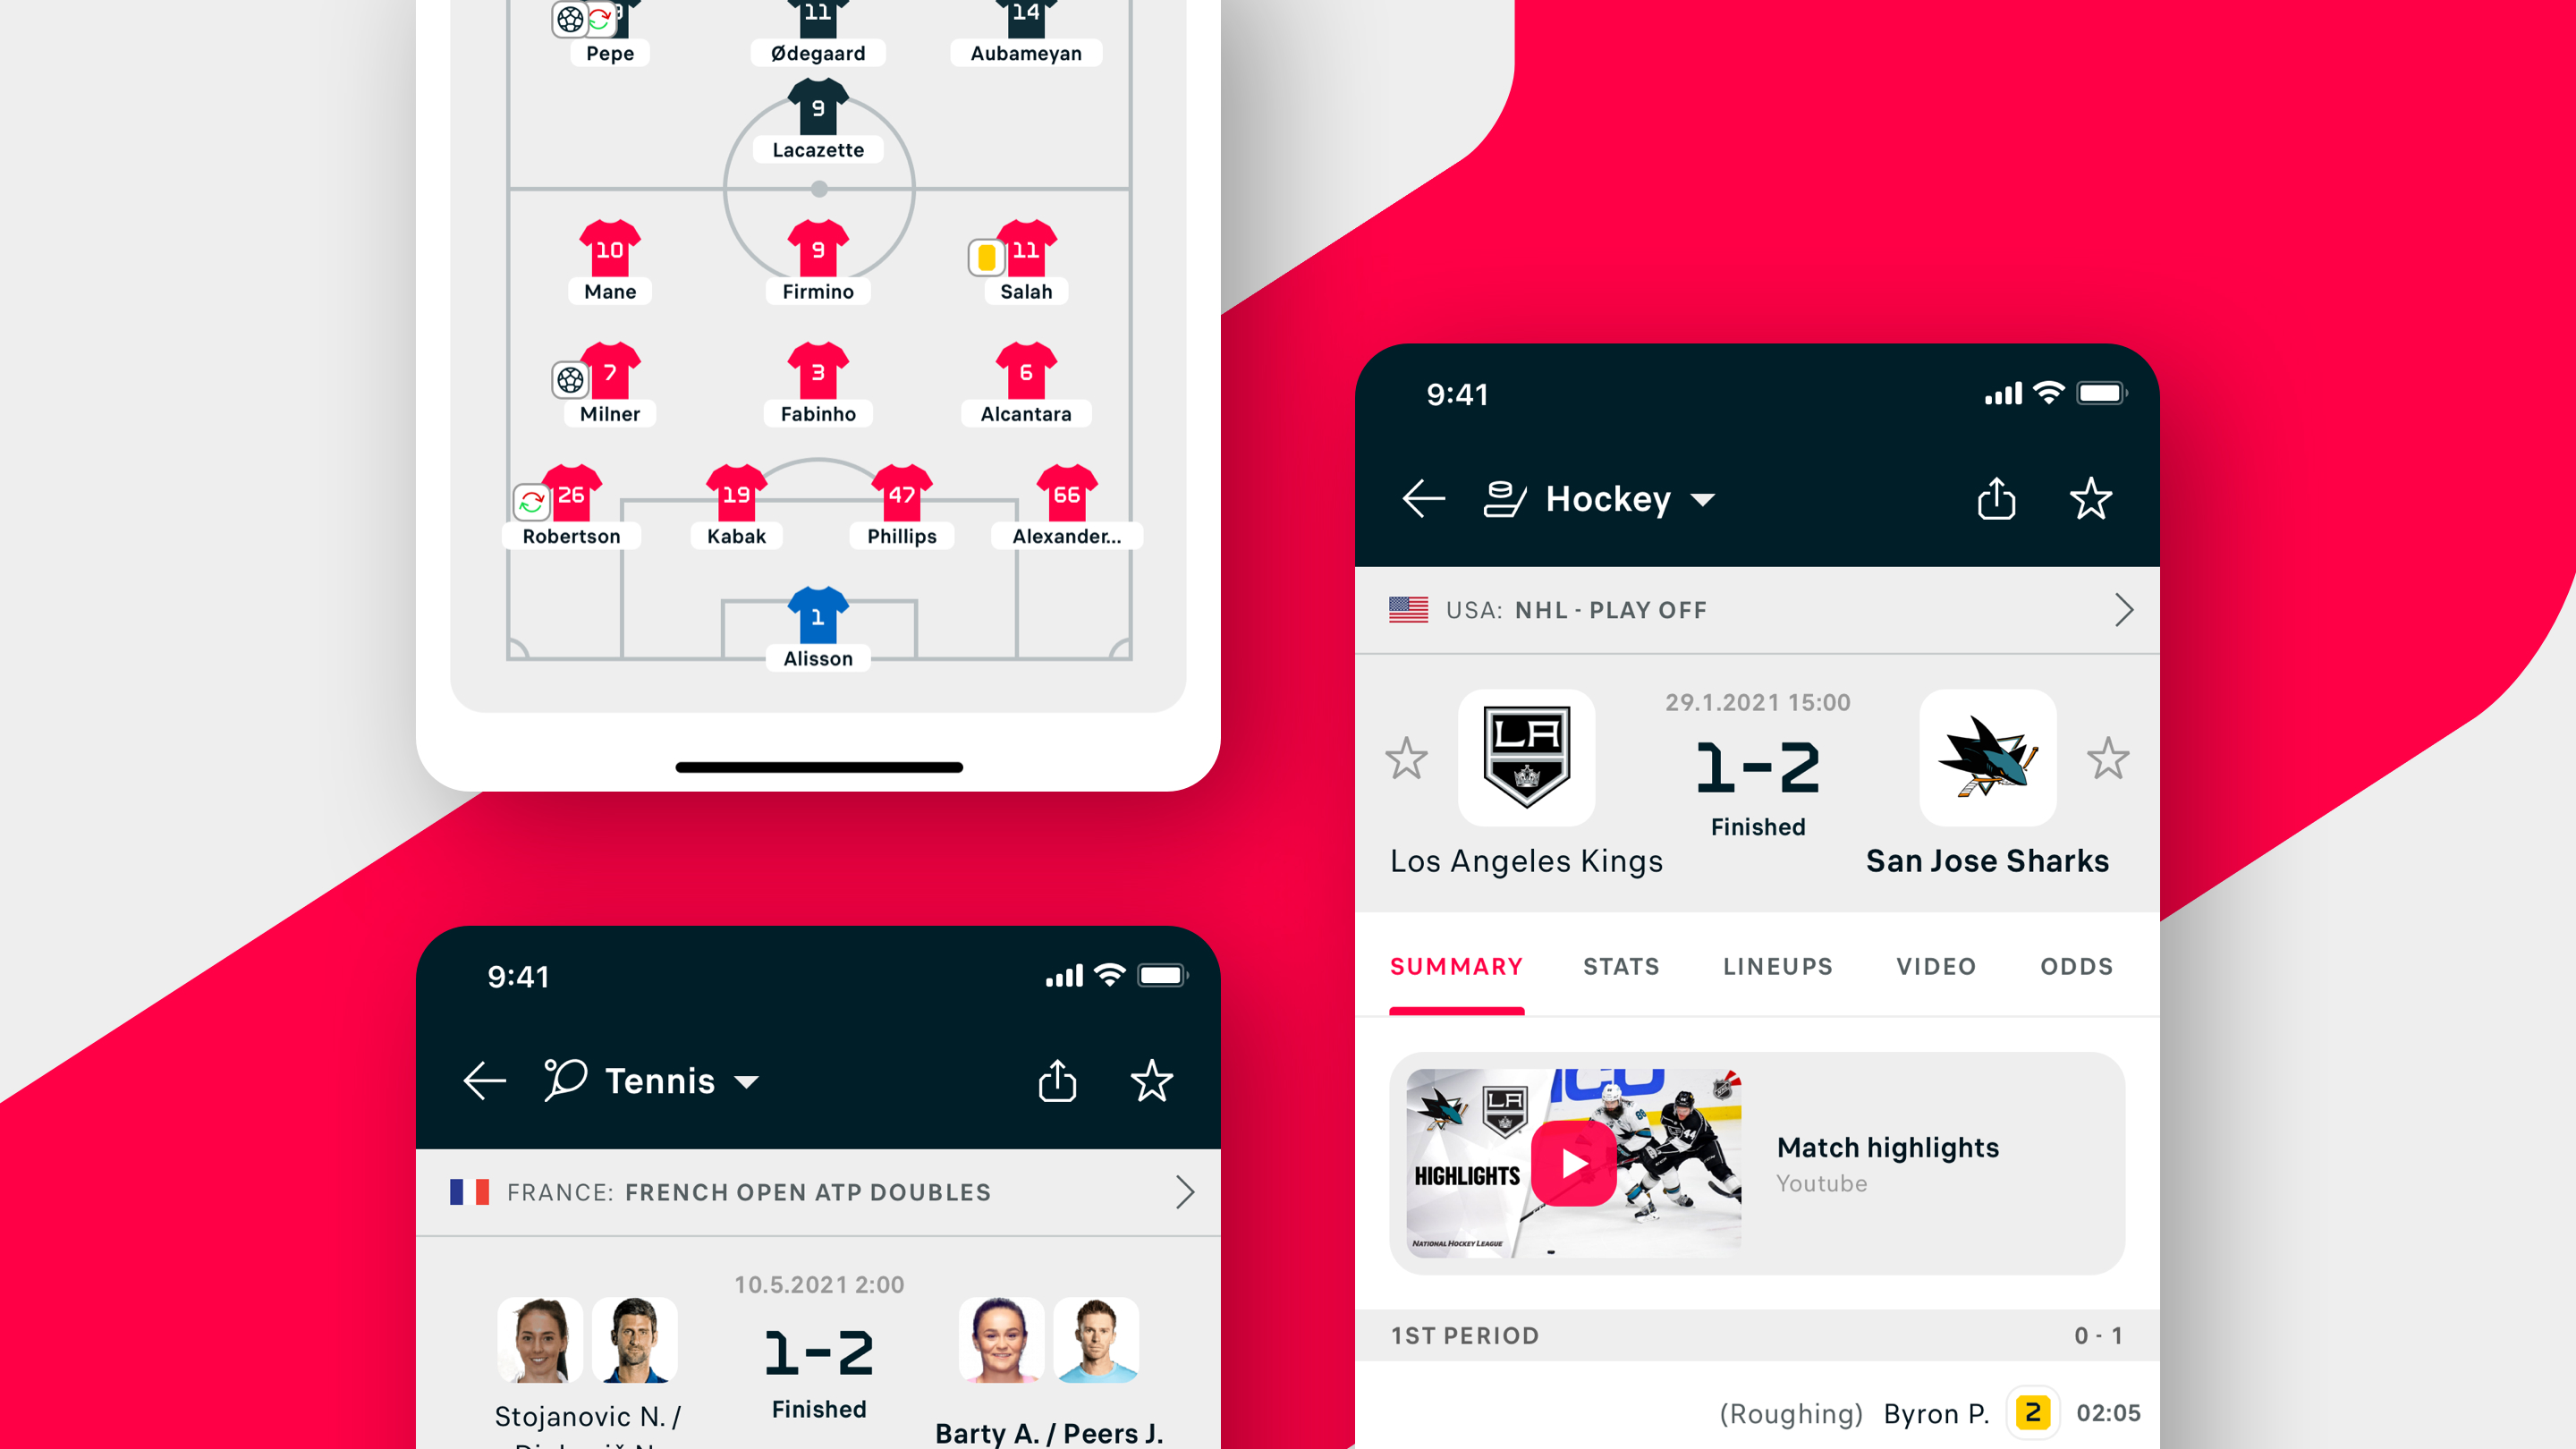
Variants were designed in Figma and specified for engineering handoff. Post-launch, I monitored results until statistical significance — applying the p-value discipline I introduced to the team — and documented every outcome, positive or negative, in a shared learnings library. Failed experiments were treated as findings, not failures; they fed the next cycle of hypotheses.
Final Design
The Solution
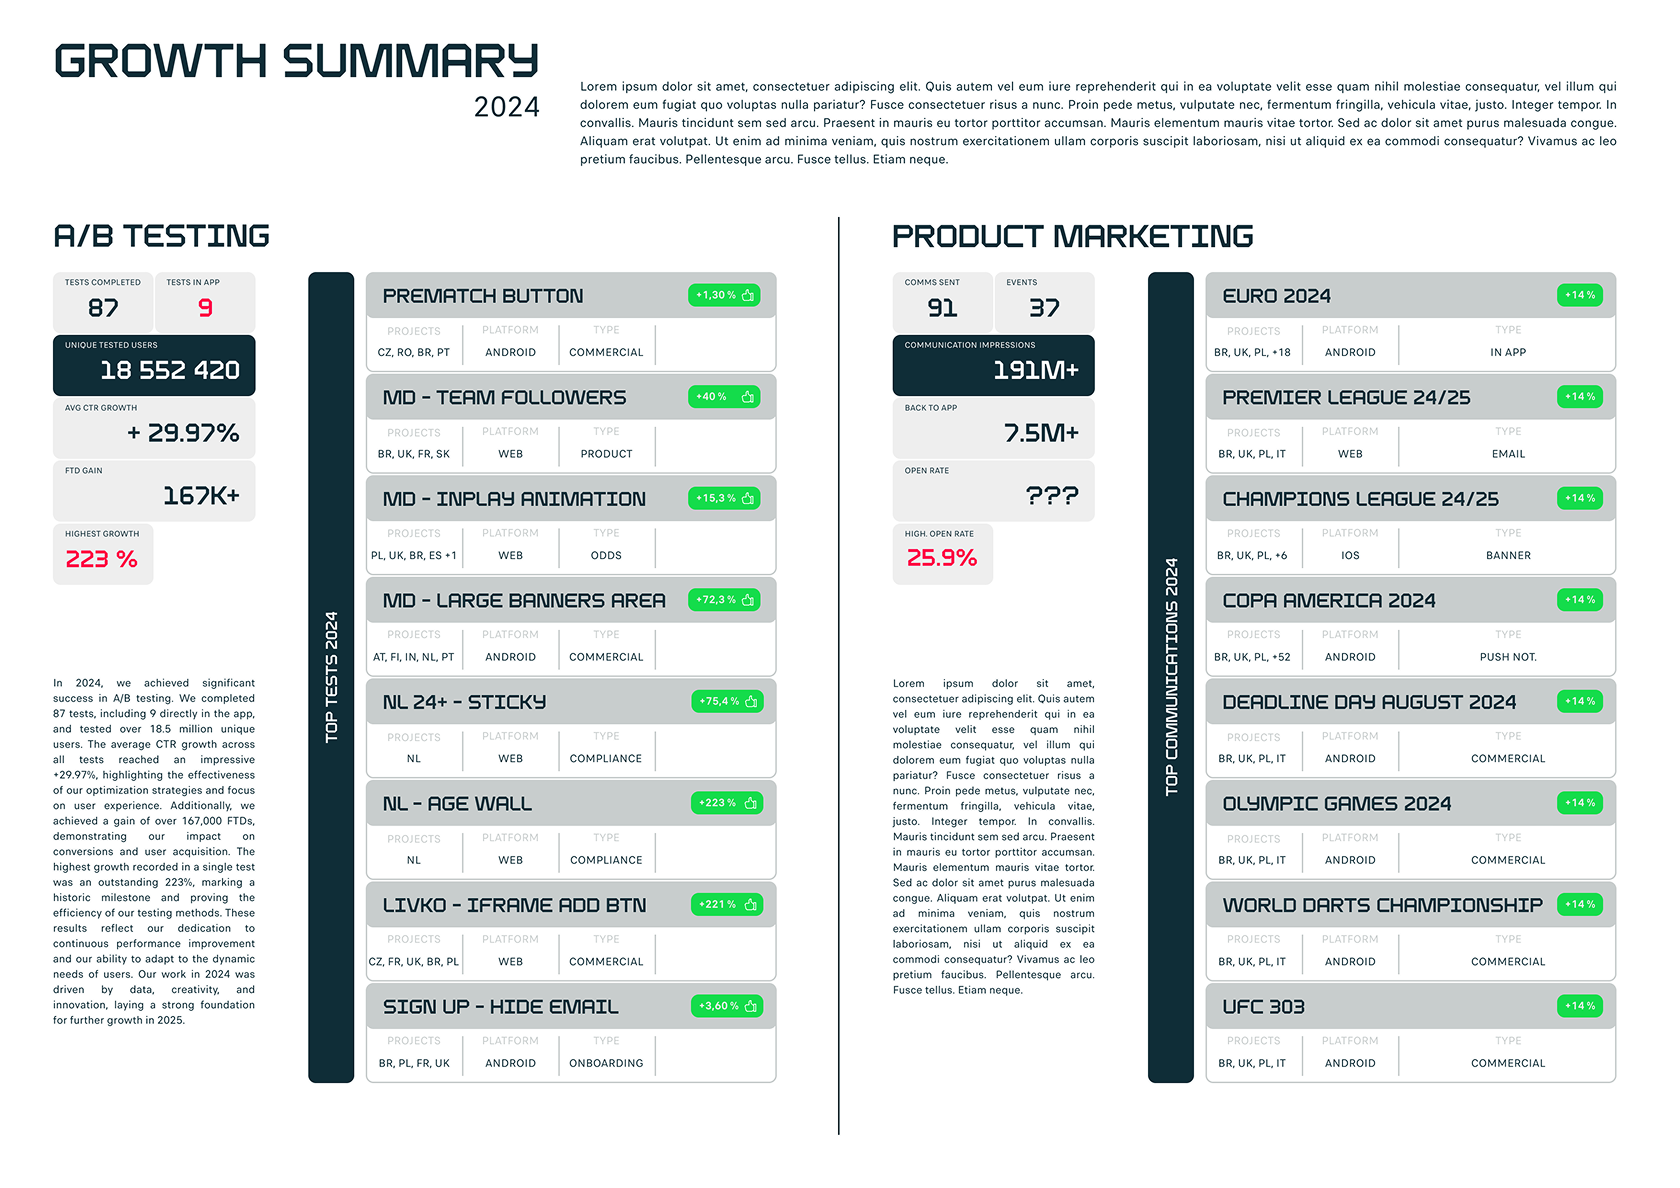
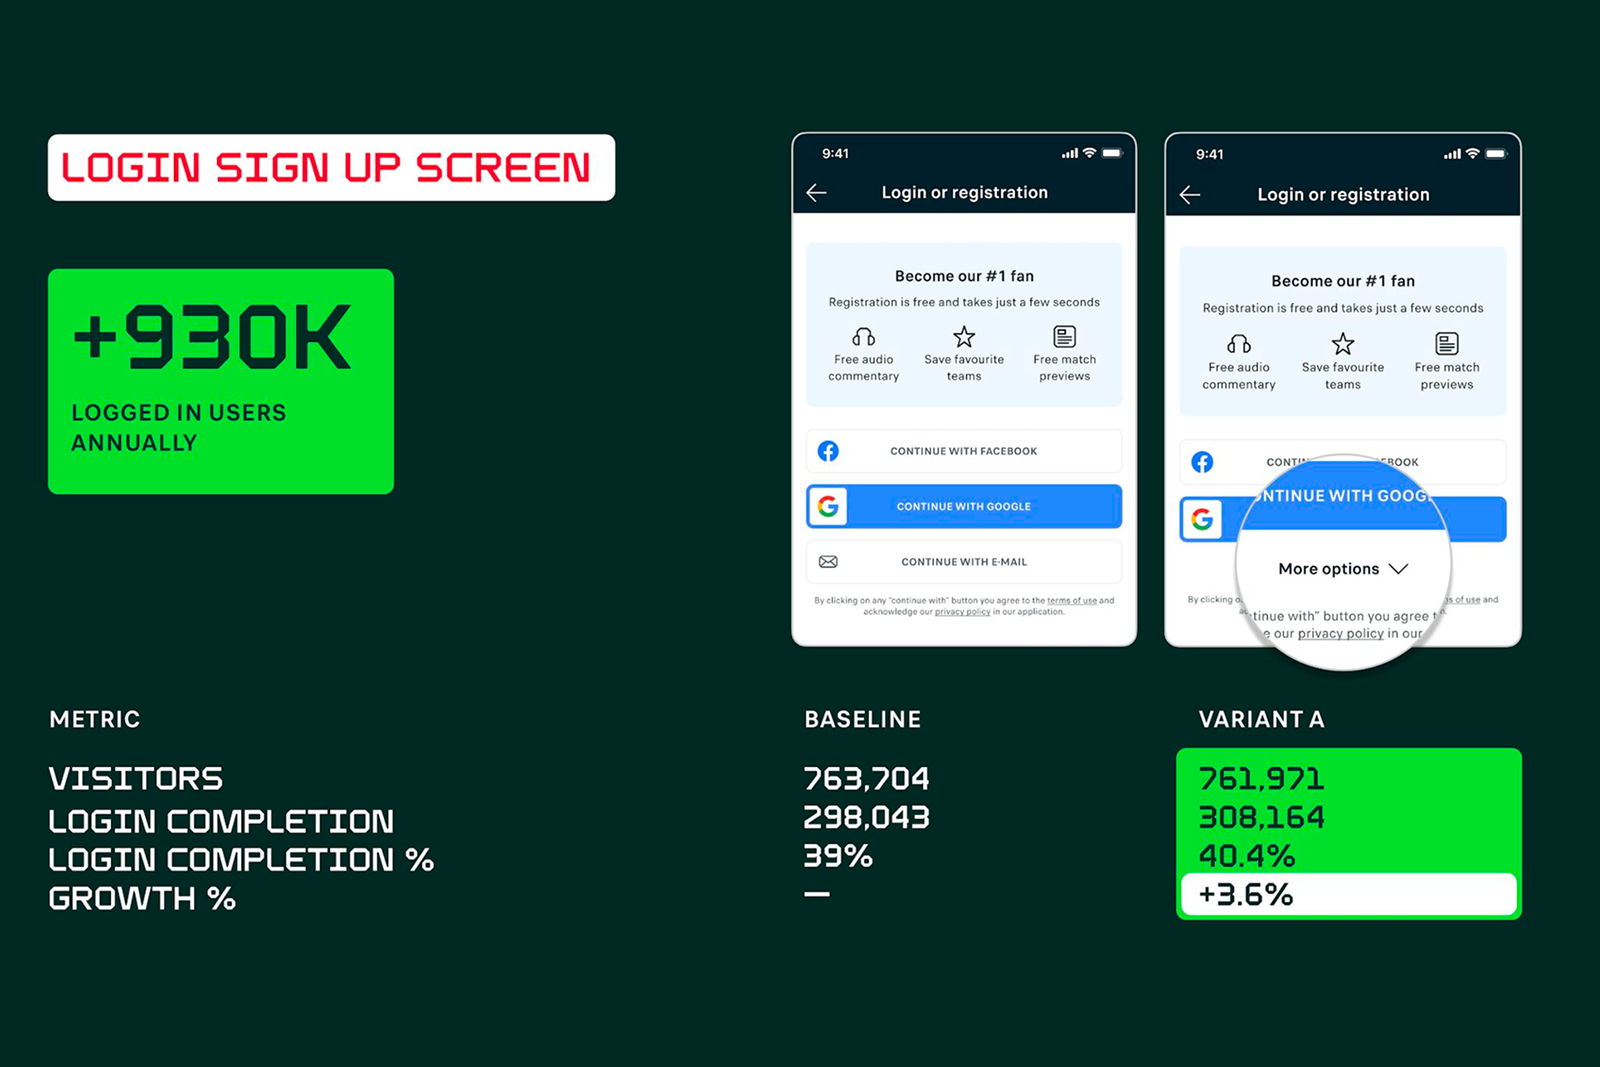
Measurable CTR and FTD conversion uplifts on key monetised placements, validated through controlled experiments
A team-wide research methodology built on Microsoft Clarity heatmaps and session recordings
Proper statistical evaluation
p-values and significance thresholds — adopted as standard team practice